You press GRAPH and get an error, a blank screen or a picture that makes no sense. When a TI-84 is not graphing, the cause is almost always a setting, not a broken calculator. This guide walks through every common reason and the exact keys to fix it.
Quick answer
- Error when you press GRAPH: turn off Stat Plots with 2nd Y= 4 ENTER.
- Blank screen: reset the window with ZOOM 6, or fit it with ZOOM 0.
- Equation missing: check that its = sign is highlighted on the Y= screen.
- Sine looks flat: switch MODE to RADIAN or press ZOOM 7.
TI-84 Not Graphing: Quick Fix Table
Find what you see on the screen, then jump to the full fix below.
| What you see | Most likely cause | Fix |
|---|---|---|
| ERR:INVALID DIM | A Stat Plot is on with empty lists | Turn off plots |
| Axes but no line | Equation off, or graph outside the window | Select it or change the window |
| ERR:WINDOW RANGE | Xmin is not less than Xmax | Fix the window |
| Sine or cosine looks flat | DEGREE mode | Use RADIAN or ZTrig |
| Y= shows X₁T or r₁ | Parametric or polar mode | Switch to FUNCTION |
| ERR:SYNTAX | A typing mistake in Y= | Use Goto |
| Extra lines or shading | Old drawings on the graph | ClrDraw |
ERR:INVALID DIM When You Press GRAPH
This is the most common reason a TI-84 will not graph. A Stat Plot is turned on, but the list it uses is empty or was deleted. The calculator tries to draw the plot with your function and stops.
Leave the error
Press 1 to choose Quit.
Open STAT PLOTS
Press 2nd Y=.
Turn all plots off
Press 4 to paste PlotsOff, then press ENTER. The screen says Done.
Graph again
Press GRAPH. Your function now draws normally.
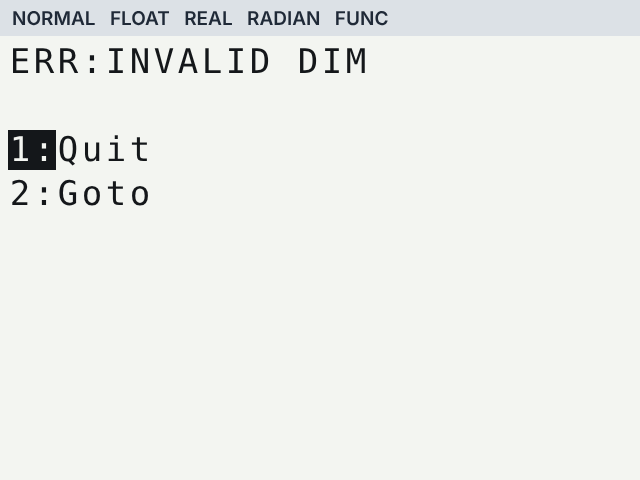
If you see ERR:DIM MISMATCH instead, a plot is on and its two lists have different lengths. Fix the lists in STAT 1, or turn the plot off the same way.
The Equation Is Turned Off
On the Y= screen, the = sign of each equation that will graph is highlighted. If you accidentally pressed ENTER on it, the highlight disappears and that equation is skipped.
Open Y=
Press Y= and look at the = sign next to your equation.
Select it again
Move the cursor left onto the = sign and press ENTER so it is highlighted.

The Graph Is Off the Screen
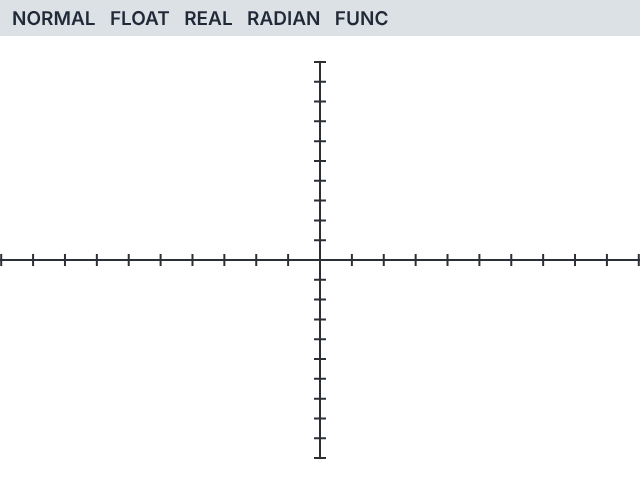
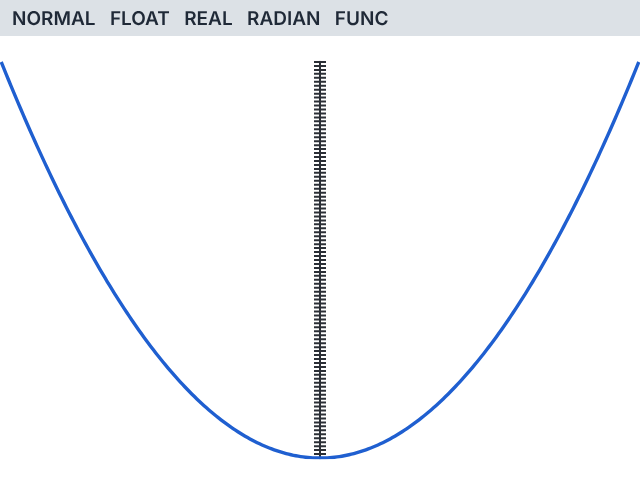
Sometimes the TI-84 graph is not showing because it is drawn outside the window you are looking at. For example, y = x² + 20 never goes below 20, so in the standard window that stops at 10 you only see empty axes.
Standard window
Resets the view to −10 to 10 on both axes. Try this first when the window looks strange.
ZOOM 6
ZoomFit
Keeps the x range and stretches the y range so the whole curve fits.
ZOOM 0
Set it yourself
Press WINDOW and type the Xmin, Xmax, Ymin and Ymax you need.
WINDOW
ERR:WINDOW RANGE
This error means the window settings are impossible, usually because Xmin is equal to or bigger than Xmax, or Ymin is equal to or bigger than Ymax. It often happens after typing a negative sign in the wrong place.
Choose 1: Quit, press WINDOW and make sure each minimum is smaller than its maximum. The fastest fix is ZOOM 6, which puts back the standard window.
Trig Graphs Look Flat or Wrong
If y = sin(x) shows up as an almost straight line, the calculator is in DEGREE mode. One full wave in degrees takes 360 units, so the standard window from −10 to 10 only shows a tiny piece of it.
Use radiansPress MODE, choose RADIAN and graph again.
Or use ZTrigPress ZOOM 7. It sets a window made for trig graphs in the current angle mode.
The Calculator Is in the Wrong Graph Mode
If the Y= screen shows X₁T and Y₁T, or r₁, instead of Y1, the TI-84 is in parametric or polar mode. Equations you typed earlier in function mode are still saved, just hidden.
Press MODE, move down to the row with FUNCTION, highlight FUNCTION and press ENTER. Your Y1 to Y0 equations come back.
ERR:SYNTAX When Graphing
A syntax error on the graph screen means something in one of your equations cannot be read. The usual suspects are the subtraction key used for a negative number, a missing closing parenthesis, or an extra symbol at the end.
Choose 2: Goto. The TI-84 opens Y= with the cursor on the problem, so you can fix it and press GRAPH again.
Missing Axes or Extra Lines on the Graph
| Problem | Fix |
|---|---|
| No x or y axis | Press 2nd ZOOM (FORMAT) and choose AxesOn |
| Old shading or drawn lines | Press 2nd PRGM (DRAW), then 1 for ClrDraw and ENTER |
| A line you do not recognise | Check Y2 to Y0 for old equations and clear them |
| Dots on the graph that are not your function | A Stat Plot is drawing data. Turn it off with PlotsOff |
The Graph Takes Forever or Freezes
A complicated equation, a huge window or a slow shading command can keep the busy indicator moving for a long time. Press ON to stop it. You will see ERR:BREAK; choose 1: Quit and simplify the equation or the window.
If the whole calculator is frozen and no key responds, follow the steps for a frozen TI-84 in our guide on how to turn off and reset a TI-84.
Still Not Graphing? Try These Last Steps
Check every Y= line
Clear any equation you do not need, including ones far down the list.
Reset the window and mode
Press ZOOM 6, then check MODE for FUNCTION and RADIAN.
Reset RAM
As a last resort, a RAM reset puts every graph setting back to normal. It also deletes lists and equations, so copy down anything you need first.
Want to test your equation somewhere else? Type it into our free TI-84 calculator online. If it graphs there, the problem is a setting on your handheld.
Frequently asked questions
Why is my TI-84 not graphing anything?
The three most common reasons are a Stat Plot left on, an equation whose = sign is not highlighted, and a window that does not include the curve. Check them in that order.
How do I turn off Stat Plots on a TI-84?
Press 2nd Y= to open STAT PLOTS, press 4 to paste PlotsOff and press ENTER. All three plots turn off at once.
Why does my TI-84 graph show only the axes?
The curve is probably outside the current window, or the equation is switched off. Try ZOOM 0 for ZoomFit, then look at the Y= screen.
Why does sin(x) look like a straight line on my TI-84?
The calculator is in degree mode, so one wave is 360 units wide. Change MODE to RADIAN, or press ZOOM 7 for a trig window.
Does resetting a TI-84 fix graphing problems?
Usually, yes, because it restores the default window, mode and plot settings. Try the quick fixes first, since a reset also erases your lists and equations.